
Honest Answers Need Somewhere Safe to Land
Ask employees directly whether they trust senior leadership and watch what happens: polite scores, cautious comments, and a report that tells you nothing. People withhold whatever could be traced back to them. Anonymity is not a nice-to-have in culture measurement — it is the entire data-quality strategy.
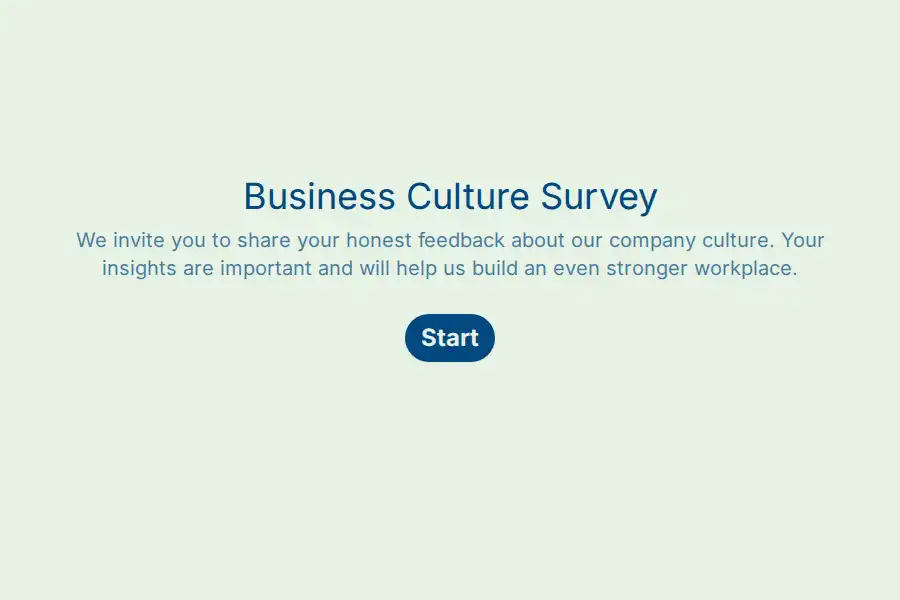
This business culture survey is built around that premise. It collects no names, no email addresses, and no free-text details that could identify a respondent. What it does collect, every quarter, is a candid read on psychological safety, leadership trust, and whether stated values survive contact with daily work.
Engineering the Anonymity Promise
An anonymity promise is only credible if the instrument honors it. Before launching:
- Strip identity fields entirely — no name, no email, no employee ID. The form simply never asks.
- Segment with coarse categories only. A dropdown for department and broad tenure bands (under 1 year, 1–3, 3–5, 5+) gives you comparison groups without fingerprinting anyone. In a department of five people, even the department label is identifying — drop the segment rather than pretend.
- Say what you are doing in the invitation. Employees should read, in plain language, that responses carry no identifiers and that results are reported only in aggregate.
What Each Quarterly Pulse Measures
- Advocacy: the standard 0–10 recommend-as-a-place-to-work question via the NPS question type — your single most comparable quarter-over-quarter number.
- Psychological safety: opinion scale statements such as ‘I can disagree with my manager without consequences’ and ‘bad news travels upward here.’
- Leadership trust: whether decisions are explained, commitments are kept, and communication stays honest during uncertain periods.
- Values in practice: a yes or no question — ‘I have seen our stated values influence a real decision in the past three months’ — which reveals far more than asking whether values are important.
- The one thing: an open field asking for the single change leadership should make next quarter. One question, one answer, and consistently the most-read field in the report.
A visible progress bar keeps the whole pulse under four minutes.
Run It Like a Pulse, Not a Project
Quarterly cadence works because it is short enough to repeat and frequent enough to catch drift. Duplicate the form each cycle — keeping wording identical so scores stay comparable — share the link, and close it after a fixed two-week window. The survey response rate calculator tells you what participation you need before the results are worth acting on.
Read Results Like a Trustee
Open the aggregated response view with HR-only access — role-based permissions keep raw comments out of general circulation. Resist slicing small groups: a filter that isolates three respondents is a breach of the promise you made. Then close the loop visibly. Publish two or three ‘you said, we did’ commitments each quarter, because next quarter’s response rate is purchased with the actions you take on this one.
Related pulse formats sit in the employee engagement collection.
Frequently Asked Questions
What is a business culture survey?
A short, recurring, anonymous measurement of how employees experience leadership, psychological safety, and company values — designed to repeat on a fixed cadence so movement becomes visible.
How can I guarantee the survey is truly anonymous?
By design, not by assurance: collect no identifying fields, use only coarse segments, avoid filters that isolate small groups, and describe the approach honestly in the invitation. Employees trust mechanics, not promises.
How often should we run it?
Quarterly suits most organizations — long enough for initiatives to take effect, short enough to catch drift after reorganizations or leadership changes.
What is a good participation rate?
Above 70% generally produces dependable aggregates; below 50%, treat results as directional only. The response rate calculator helps you set a realistic target before launch.
What should we do with a bad score?
Treat it as the survey working. Share the number, name two concrete responses, and report back next quarter on what changed — visible follow-through is what turns a pulse into a culture practice.